There’s a $15 Million Bitcoin Sell Wall Stopping $11,500 From Breaking
Bitcoin is pushing higher after correcting as low as $10,600 on Tuesday. As of the time of this article’s writing, the asset trades for $11,200 — a price point nearly 20% higher than that seen seven days ago and one 3% higher in the past 24 hours.
Analysts believe that this small rally is a precursor to a break of the ongoing consolidation to the upside.
Yet according to order book data shared by a trader, Bitcoin may have trouble resolving higher as it faces strong resistance.
Related Reading: Crypto Tidbits: Ethereum Surges 20%, US Banks Can Hold Bitcoin, DeFi Still in Vogue
Bitcoin Could Have Trouble Breaking Past $11,500
On Monday, Bitcoin’s rally topped out at $11,500. It isn’t clear why that is but that level has been a historically important technical level for the leading cryptocurrency.
As BTC has begun to inch higher over recent hours, traders are looking for Bitcoin to break past $11,500 to sustain the uptrend.
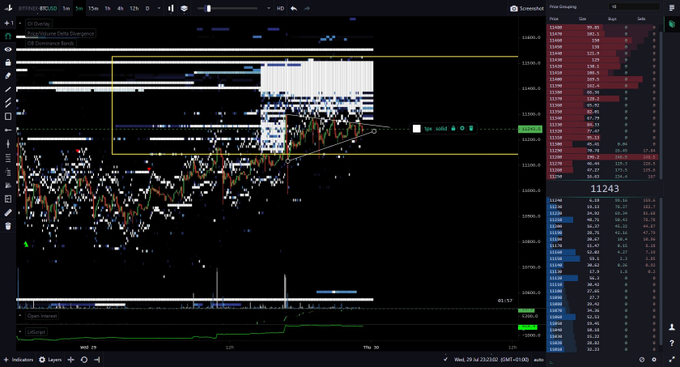
According to order book data shared by a trader, this may be a tall ask of buyers, though. According to a chart of BTC’s recent price action with the Order Book Dominance Bands indicator, there is approximately $15 million worth of sell orders from $11,300-11,500 preventing upside. This data pertains to Bitfinex.
Chart of BTC's recent price action with the order book dominance bands from trader "Coiner-Yadox" (@yodaskk on Twitter). Custom chart from TradingLite.
There was no order book data from other crypto exchanges shared by the trader.
Bitcoin could rocket past these order book resistances if there is enough buying volume. But it’s important to note Bitfinex order book has had historical accuracy in calling BTC price action.
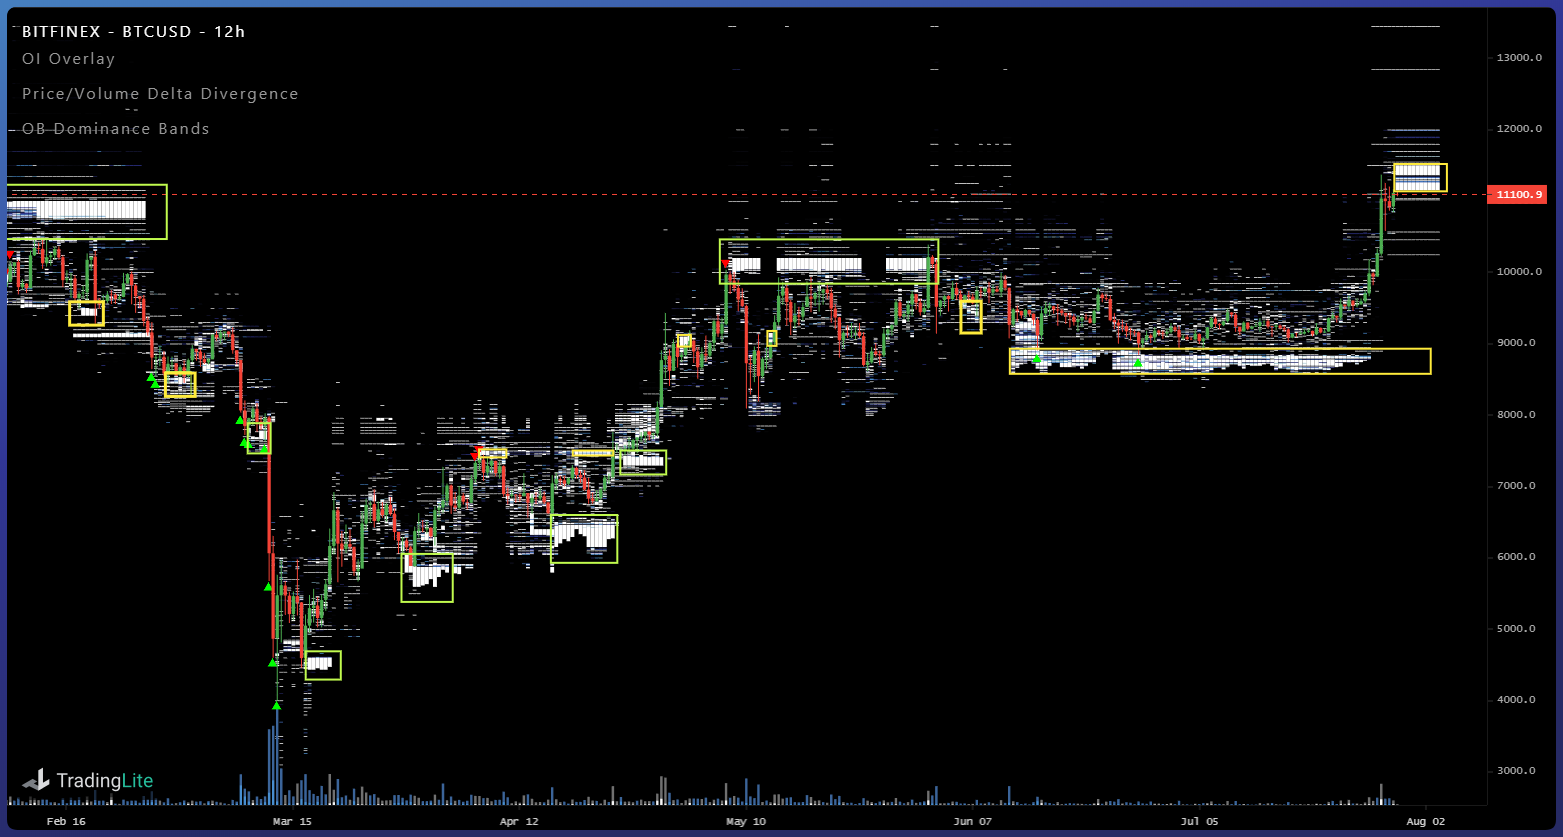
The same trader shared the chart seen below a bit earlier. It shows that the Bitfinex order book predicted many of Bitcoin’s swing moves over the past five months.
Chart of BTC's recent price action with the order book dominance bands from trader "Coiner-Yadox" (@yodaskk on Twitter). Custom chart from TradingLite.
Bulls in Control?
Some are ignoring the order book, though, arguing that from a pure charting perspective, Bitcoin bulls are in control.
As reported by NewsBTC, one trader shared that as long as BTC holds $10,500, its outlook is bright:
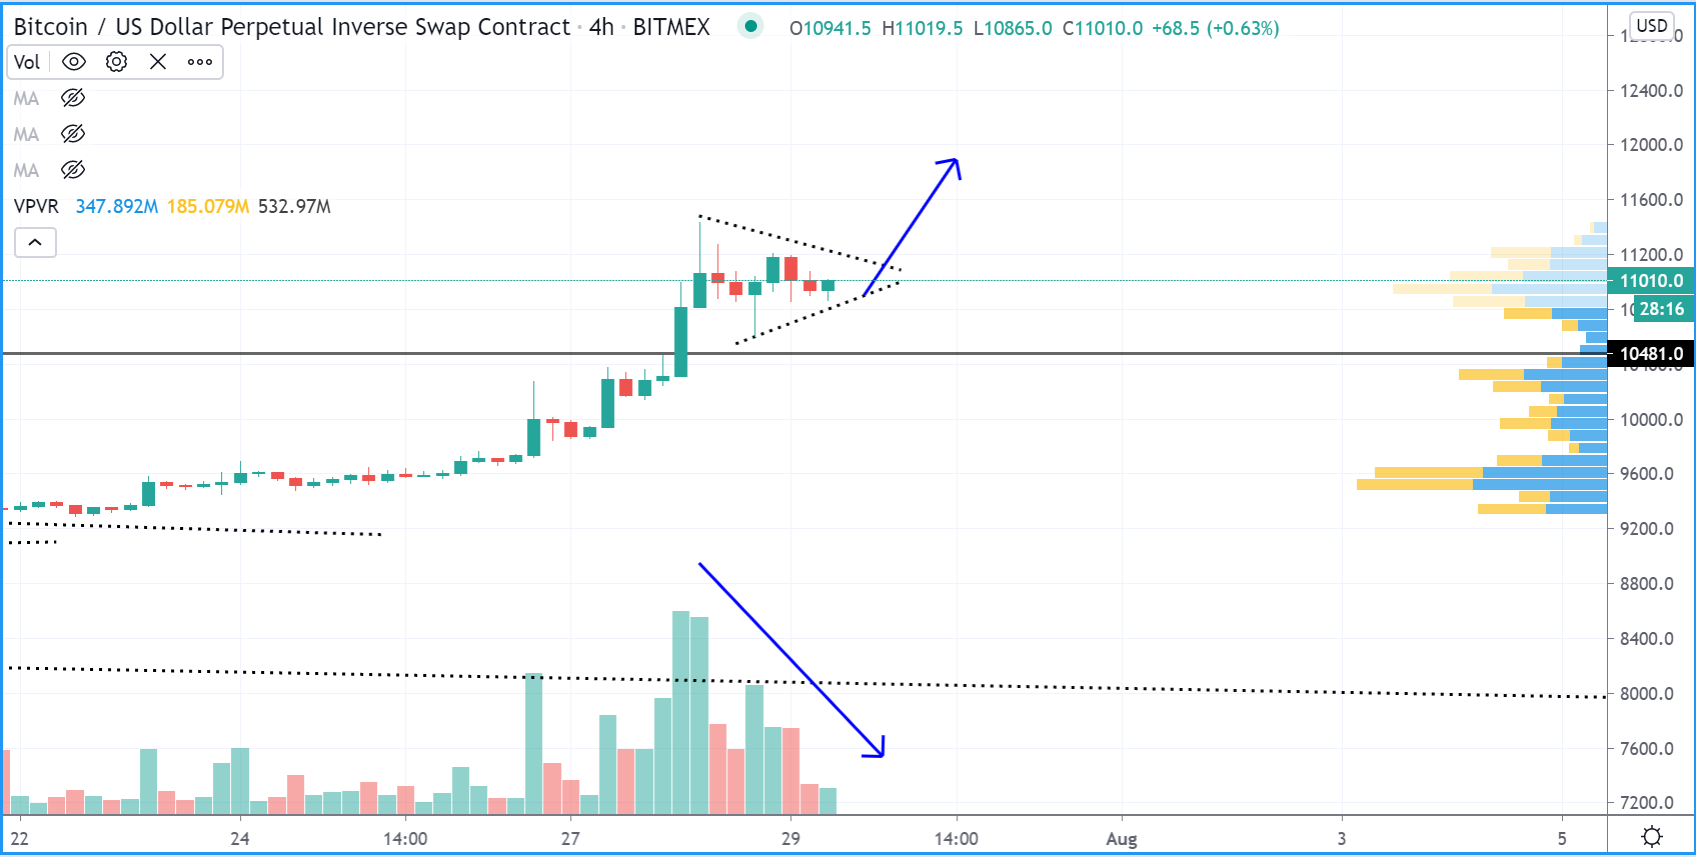
“$btc consolidating above a pretty key breakout level. price contracting, volume declining, seems bullish, continuation soon,” he wrote, referencing the macro importance of $10,500. $10,500 is the price point that Bitcoin failed to cross above on three separate occasions over the past 12 months: once in October, once in February, and once in early June.
Chart of BTC's recent price action by trader SmartContracter (Twitter handle). Chart from TradingView.com
The trader who made this assertion is the same who predicted that Bitcoin would bottom 2018’s bear trend at $3,200.
Related Reading: On-Chain Metric Signals the BTC Market Isn’t Overheated: Why This Is Bullish
Featured Image from Shutterstock
Price tags: xbtusd, btcusd, btcusdt
Charts from Tradingview.com
There's a $15 Million Bitcoin Bull Wall Stopping $11,500 From Breaking
from NewsBTC https://ift.tt/3felOm9


Comments
Post a Comment